
Where your fleet's fuel money is really going
Most fleet fuel waste comes from two places: idling above a sensible target, and the gap between trucks doing the same work. Here is how to see both.
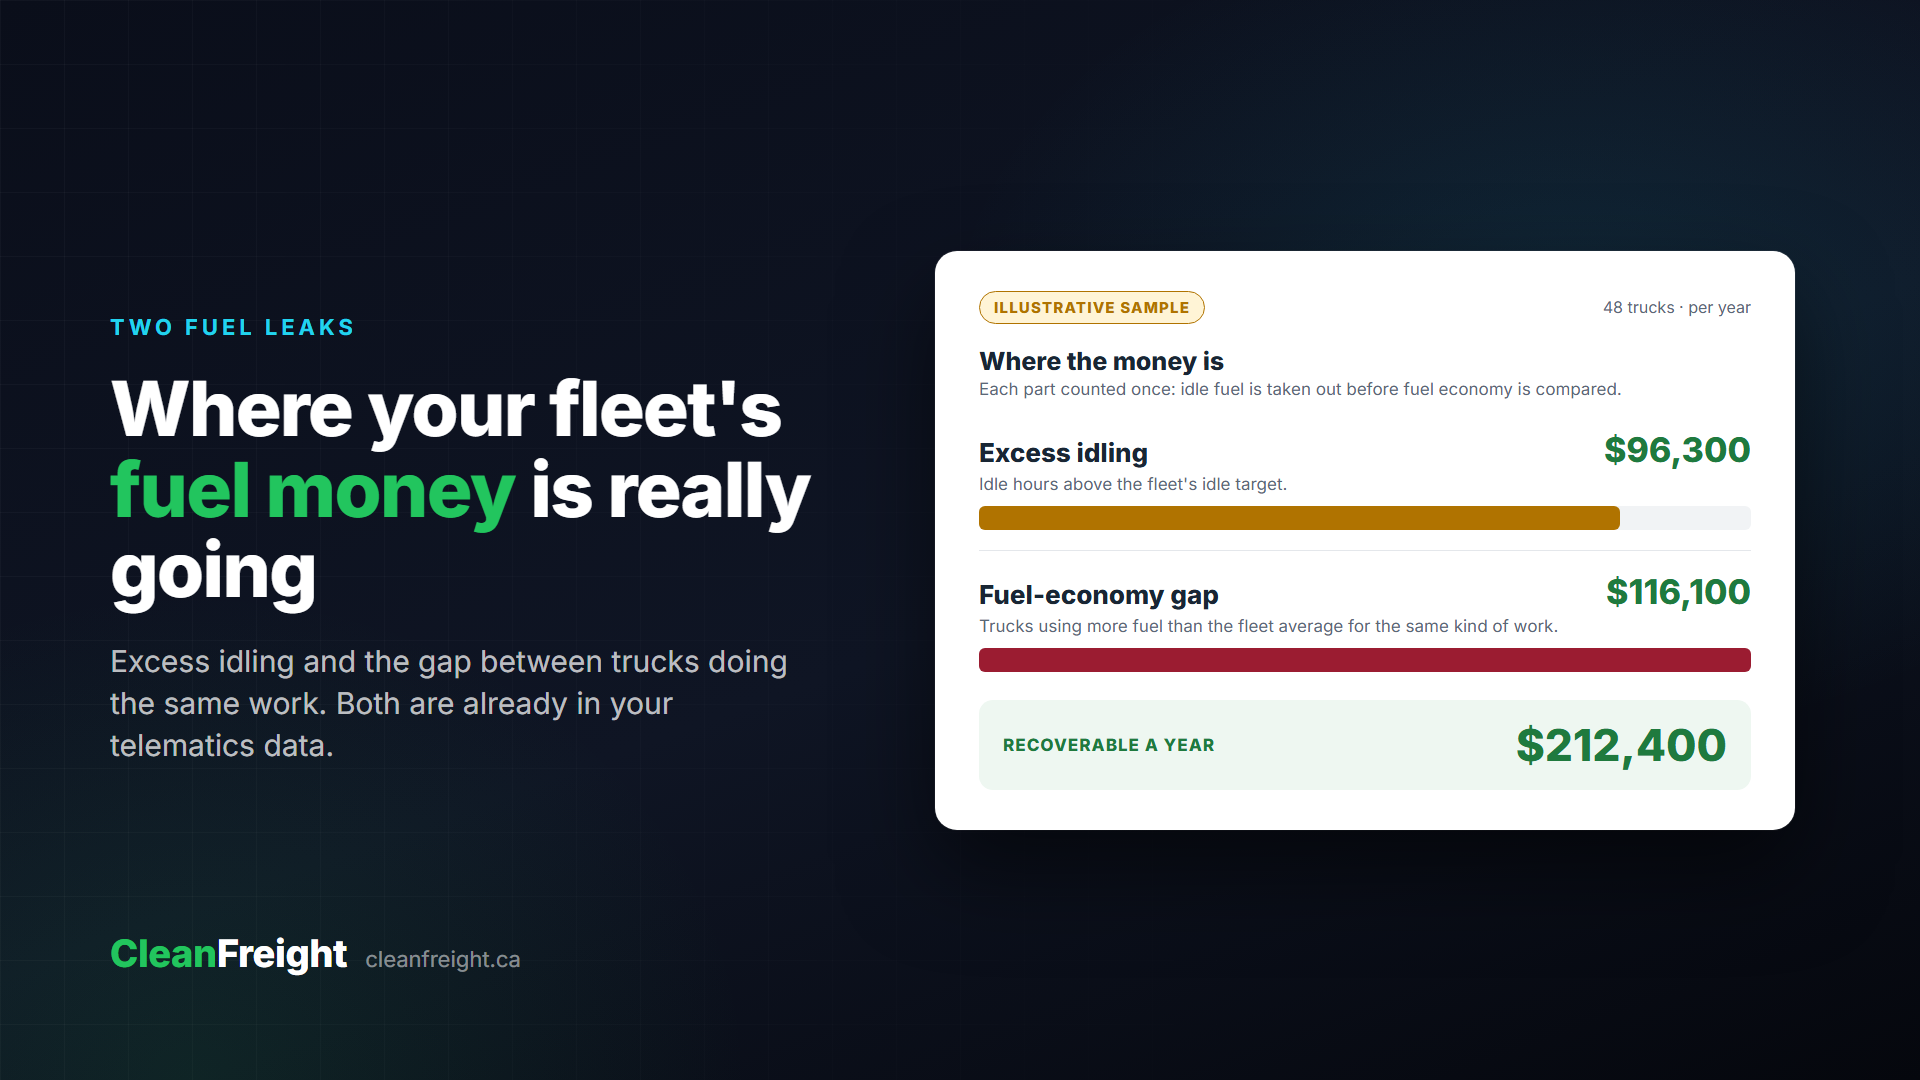
Fuel is usually the biggest bill a trucking fleet pays after wages. Most owners know roughly what they spend on it in a year. Far fewer know how much of that spend did no useful work.
When we assess a fleet's fuel, the waste almost always comes from two places. Neither is a secret, and neither needs new equipment to find. Both are already sitting in the telematics data the fleet is paying for. They just have not been turned into dollars.
Leak one: idling above a sensible target
Every truck idles. Drivers wait at docks, warm up engines in January, sit in traffic and run the heat or air conditioning during breaks. Some idling is part of the job, and nobody should pretend it can be taken to zero.
The real question is how much is too much. Our assessments use a default target of 30% of engine time: idling up to that share counts as normal, and every hour above it counts as excess. A fleet can choose a tighter target if that suits its work, and some do.
Excess idle hours are turned into litres at about 4 litres an hour, a typical burn for a highway tractor, then into dollars at the current diesel price.
Here is what that looks like in six real fleets we have assessed, using 12 months of data each, at CA$2.68 a litre (Canadian average, week of Oct 20, 2026):
- An 11-truck dry van fleet idling 50% of engine time: about $51,000 a year above target.
- A 49-truck dry van fleet idling 42%: about $151,000 a year.
- A 39-truck drayage fleet idling 50%: about $151,000 a year, or 8.3% of all the fuel it bought.
- A 34-truck heavy-haul fleet idling 43%: about $120,000 a year.
- A 91-truck LTL fleet idling 59%: about $504,000 a year.
- A 166-truck refrigerated fleet idling 49%: about $604,000 a year.
Per truck, that works out to roughly $3,100 to $5,500 a year, every year, for fuel that moved nothing.
These were not careless fleets. Most had an idle policy of some kind. The idle hours had simply never been added up and priced.
Leak two: the gap between trucks doing the same work
The second leak is quieter. Put two trucks on the same kind of work and one will often burn noticeably more fuel per kilometre than the other. Spread that difference across a fleet and a year, and it adds up.
The hard part is comparing fairly. A truck on city deliveries will always use more fuel per kilometre than one running the highway, and that is not waste. So the assessment groups trucks by the kind of work they do, using average speed as the guide: highway, mixed or city.
Within each group it works out the fleet average for that kind of work and asks a simple question: if every thirstier truck performed at the fleet average, how much fuel would be saved? Idle fuel is taken out first, so nothing is counted twice. Trucks that look like they are on the wrong kind of work are shown separately rather than lumped in.
The causes behind a thirsty truck vary. It might be spec'd for different work, have a mechanical issue that crept in, or simply be on the wrong runs. The assessment does not guess at causes it cannot see in the data. It shows which trucks stand out, by how much, and the plain reason the numbers support.
That is why the full assessment looks at both leaks. The six examples above are idling only.
Why it doesn't jump out of the telematics dashboard
Today's telematics systems collect everything needed for this: fuel used, distance, engine hours and idle hours for every truck. The data is good. The issue is what a busy fleet manager has time to do with it.
A few reasons the waste stays out of sight:
- Dashboards show hours and percentages, not dollars. "48% idle" is easy to scroll past. "$151,000 a year" is not.
- Fleet averages hide the spread. A fleet average can look fine while a handful of trucks run well above it.
- Comparing like with like is manual work. Sort by fuel economy and the city trucks land at the bottom every time, which tells you nothing new.
- It is spread thin. A few extra litres per truck per day never looks like an emergency on any single day.
- It takes a full year to see clearly. One bad week is noise. Twelve months shows the pattern and evens out the seasons.
None of that is a fault of the telematics system. It was built to track trucks and drivers. Turning a year of its data into a fuel bill, truck by truck, is a separate job.
Where to start
Before changing an idle policy, buying idle-reduction equipment or sitting down with drivers, it helps to know how big each leak is and which trucks carry most of it. In many fleets a small group of trucks accounts for a large share of the waste, and that group is the obvious place to start.
It also gives you a baseline. Once you know the number, you can tell whether the changes you make are working.
Get your fleet's number
The Fleet Fuel Waste Assessment does this from 12 months of your own telematics data. It shows how many dollars a year of fuel your fleet can recover, splits that between excess idling and the fuel-economy gap between your trucks, and names the 10 trucks to look at first, with plain-language reasons. Connect Samsara, Geotab, Motive or ISAAC and most reports are ready within an hour; on any other system, upload your 12 monthly reports and the report is ready as soon as they are in.
You can try a quick estimate on the page before you decide: see what your fleet could recover. Fleets in the United States can use the US site, with pricing in US dollars: cleanfreight.io/fuel-waste-assessment.
Examples are real fleets from Clean Freight fuel assessments, with names withheld. Idling above a 30% idle target at 4 litres an hour, priced at CA$2.68 a litre (Canadian average, week of Oct 20, 2026).
One-time report
See what your own fleet is wasting
A Fleet Fuel Waste Assessment turns 12 months of your telematics data into one report: how much fuel is recoverable, where it goes, and the 10 trucks to fix first. CA$500, one time.
Join the platform and get CA$100 back. Subscribe to the CleanFreight platform within 30 days of your report and CA$100 of what you paid for the assessment comes off your first platform invoice.